


The Desk: QB Efficiency Statistic Part 2
January 28th 2011 13:32
Michael Wasco brought up a key point in the comments section of the last post regarding our new stat metric in question. The end results are eerily similar to QB Rating, with the exception that running QBs get bonuses and pure passers get hurt. So now the running factor will be divided by two in order to ensure that it does not punish pure passers but still gives a nice bonus to QBs that run it. The formula for this new statistic is pretty much derived from QB Rating, and Wasco also brought up the point that TD:INT factor is why this statistic makes Brady so dominant. Therefore, I propose we use Deep% as the INT%'s statistical modifier.
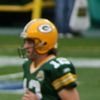
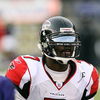
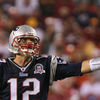
What is Deep% you might ask? This is a statistic that www.advancenflstats.com uses. It is defined as the percentage of passes that quarterback throws- complete or incomplete- that travels over 15 yards. Deep percentage will be added to the touchdown total that is multiplied to with yards per attempted pass. Let us use our classic example trio: Rodgers, Vick, and Brady. 20 percent will be used as par, so this goes by the same rule as completion percentage. We will double the effects of deep percentage as well to get more of a feel for this effect.
Brady gets a 54 (notice how each time we use Deep% his overall points total goes down by 10), Vick gets a 38.4, and Rodgers finishes off with a 33.6. So this statistic normalize Brady to a certain extent, but it did not take care of the level of play between Rodgers and Vick. This statistic shows us that statistics aren't the best way of measuring quarterback play. This is merely a tool. It shows that Brady was the most efficient of the three, but I am quizzical as to why Rodgers was the least. Now let us add another factor, supporting cast.
We will assign a value from 1-5 of each offensive contributor. 2 RBs, 1 FB, 4 WRs, 2 TEs, and 5 OLs. We will then average them up and divide. Rodgers has a supporting cast of 2.4 which is slightly below average. Vick has a 2.5 which is slightly better than Rodgers, and Brady leads the way with a 2.8. Let us divide each QB's totals by their supporting cast numbers. This leaves Brady with a 19.3, Vick has a 15.4, and Rodgers has a 14.
Overall, this statistic seems a little bit more refined than when it was first used. There are many unique modifiers. However, this statistic is merely a tool. In truth, I think Rodgers had a better year than Vick did statistically, but I do agree that Brady had the best stats this year. On the other hand, Rodgers was my season MVP because of how he led his team when it mattered most, and how Vick faded down the stretch.
My 2010 NFL MVP (Awards Coming Soon)
| 21 |
| Vote |
Add To: 


subscribe to this blog

Comment by nbageek
NBA Geek
sportsworld